Renting vs Buying a Home: Which Option Makes More Sense?
Quick Answer:
The renting vs buying a home decision is not a simple choice between throwing money away on rent or building equity in a house. Both paths incur massive, unrecoverable costs. Renting costs you pure rent, while buying costs you mortgage interest, property taxes, insurance, and maintenance. Buying makes sense if you plan to stay in the property for at least 7 to 10 years to amortize transaction costs. Renting makes more operational sense if you value career mobility, want a fixed monthly housing liability, or prefer to build wealth by investing your capital into the stock market.
For decades, conventional financial wisdom has hammered the exact same narrative into our heads: Renting is throwing your money away every month. Buying a home is the ultimate cornerstone of the American Dream.
This narrative is not just outdated—it is mathematically broken.
The real estate market has shifted dramatically. Mortgage rates are no longer at historical lows, home prices remain near all-time highs, and the pure transaction costs of purchasing a property can instantly wipe out a decade of average rental appreciation.
When I prepared to exit my last apartment, I felt an intense psychological pressure to buy a house. I felt like a failure writing a check to a landlord every month. But when I actually sat down and built an emotionless spreadsheet tracking the reality of property ownership, the math shocked me. I realized that homeownership is a high-cost business venture that forces you to bleed massive amounts of unrecoverable cash before you ever see a single dime of true equity profit.
The renting vs buying a home debate is not a test of your adulthood. It is a strict operational layout of capital allocation. Here is the definitive editorial framework to calculate the real costs of both paths, understand the hidden transaction math, and determine exactly where your money belongs.
The Concept of Unrecoverable Costs
To win the renting vs buying a home debate in your own life, you must completely discard the idea that rent is the only unrecoverable cost in personal finance.
An unrecoverable cost is any dollar you spend on housing that vanishes completely, never to be seen again. It does not build net worth; it does not lower your principal balance. It is simply the price you pay to have a roof over your head.
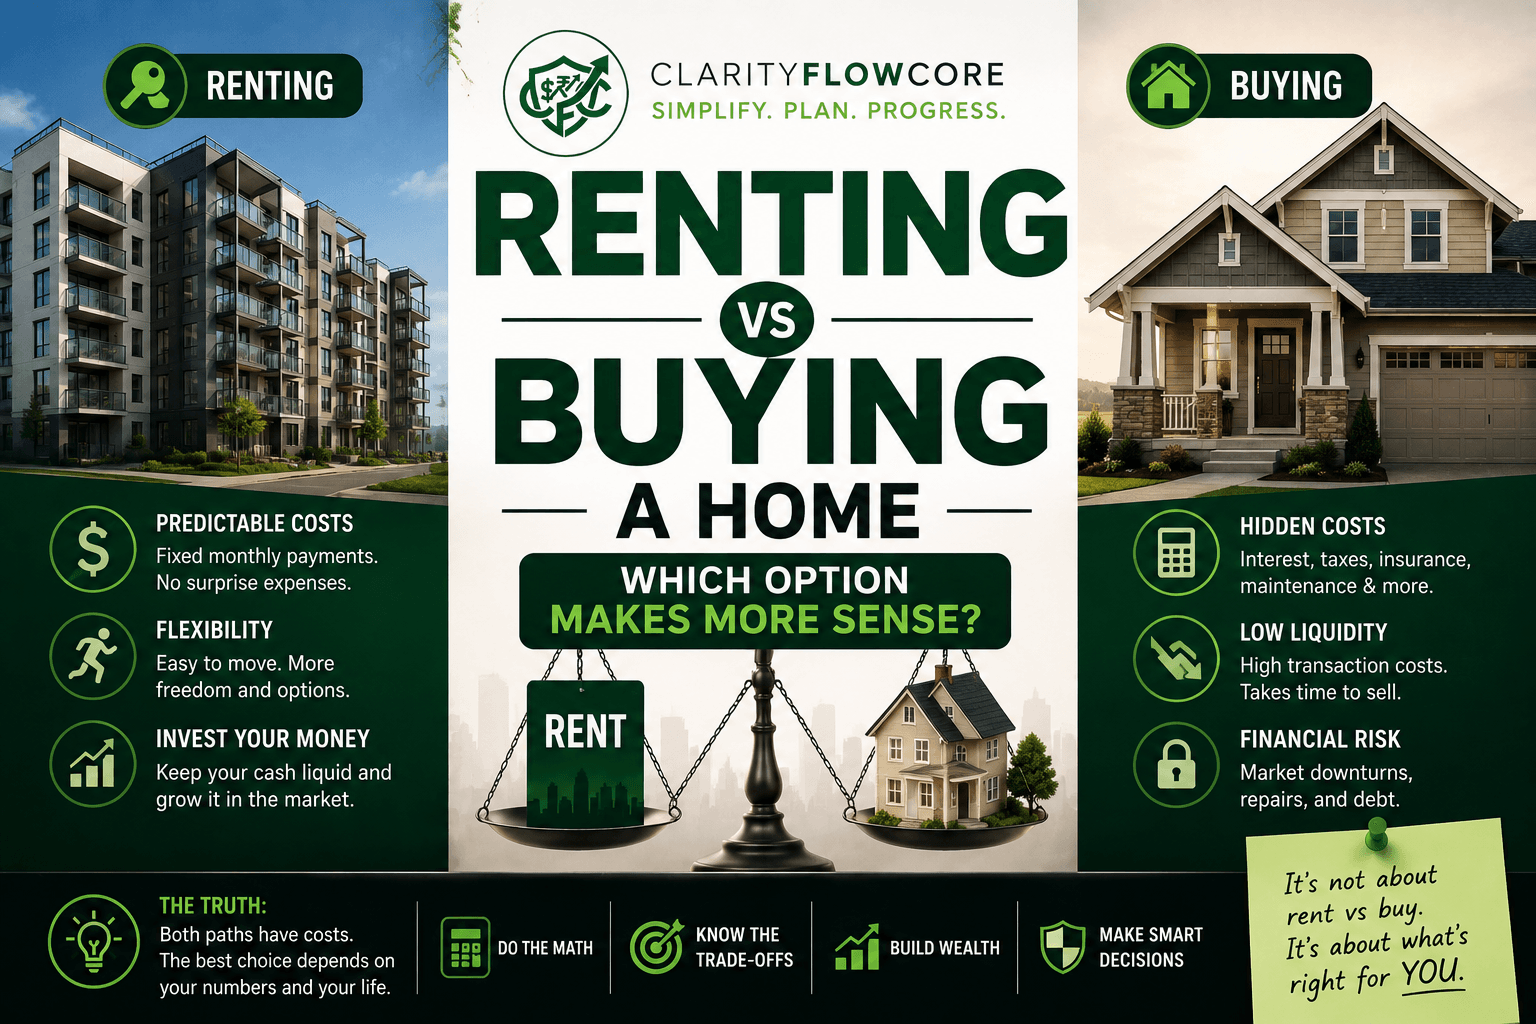
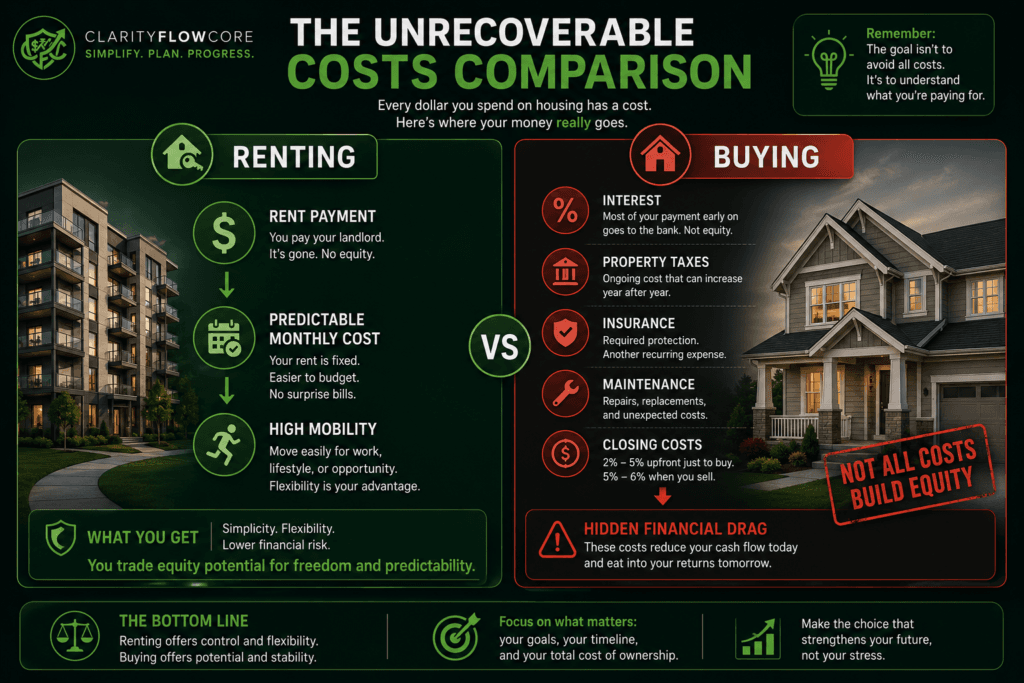
The Unrecoverable Costs of Renting
This side is incredibly simple to track. Your only unrecoverable cost is your monthly rent check. If your rent is $2,000 a month, you hand $2,000 to a landlord, and it disappears. In exchange, your monthly housing liability is capped. If the roof leaks, the HVAC system dies, or the property taxes skyrocket, your landlord absorbs 100% of the financial damage. Your maximum monthly exposure is your rent.
The Unrecoverable Costs of Buying
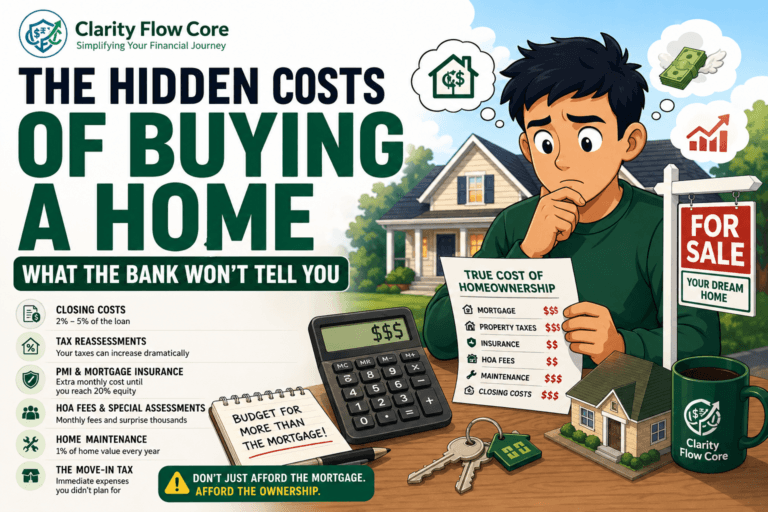
This is where the conventional narrative falls completely apart. When you buy a house, your monthly mortgage payment is not “building equity.” Only a tiny fraction of that payment does. The rest is chewed up by a monstrous trio of unrecoverable homeownership costs: Interest, Property Taxes, and Maintenance.
Let’s look at the raw math. If you buy a $400,000 home with a 6.5% interest rate, your monthly payment will be roughly $2,800. In the first few years of that loan, nearly $2,100 of that monthly payment is pure interest paid directly to the bank. It builds zero equity. Add in $400 a month for property taxes, $100 for insurance, and $300 for basic maintenance, and you discover that $2,900 a month vanishes completely into unrecoverable homeownership costs.
In this scenario, renting a similar home for $2,500 a month is actually the mathematically superior move. It leaves you with more cash in your pocket to deploy into productive assets.
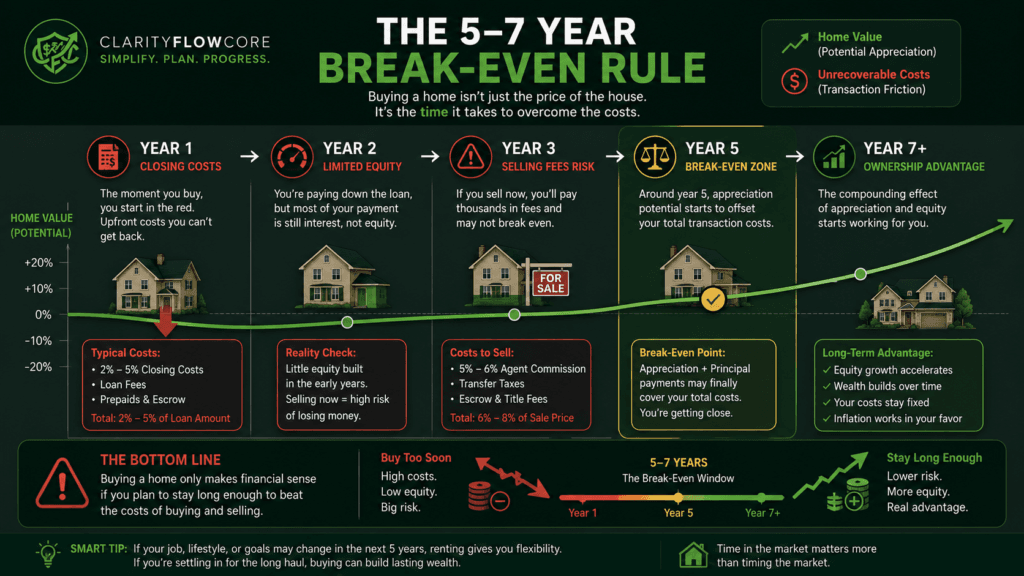
The Five-Year Rule and Transaction Friction
Real estate is an incredibly illiquid asset class characterized by massive transaction friction. When you rent an apartment, your transaction cost to move out is practically zero—you pack your boxes, hand back the keys at the end of your lease, and walk away.
When you buy a home, you are hit with massive financial penalties both when you buy and when you sell.
- The Buy Side: You must pay 2% to 5% of the total loan amount in upfront closing costs (loan origination fees, title insurance, appraisals, and escrow pre-paids). On a $400,000 home, that is $12,000 vanished on day one.
- The Sell Side: When you eventually want to move, you must pay a standard 5% to 6% agent commission, plus local transfer taxes and escrow fees. Selling that same $400,000 home costs you roughly $24,000 in transaction fees.
The Math of the Break-Even Point
Combined, it costs you roughly $36,000 in pure friction just to buy and sell a $400,000 piece of property.
If the local housing market appreciates at a standard historical average of 3% to 4% a year, it will take you roughly 5 to 7 years of pure home price growth just to break even on the transaction costs you burned to enter and exit the deal.
If you buy a house and are forced to relocate for a career opportunity or a relationship change within 3 or 4 years, you are almost guaranteed to take a massive net loss at the closing table, even if your home’s paper value went up. This is why career flexibility is one of the most under-discussed variables in the renting vs buying a home equation.
Case Study: The Raw Numbers
Let’s look at a head-to-head operational comparison over a 10-year timeline. We will compare two individuals: Sarah, who decides to rent a modern townhouse, and John, who decides to buy an identical townhouse next door.
The Real Estate Baseline:
- Property Value / Purchase Price: $450,000
- Down Payment (10%): $45,000
- Mortgage Interest Rate: 6.5%
- Sarah’s Monthly Rent: $2,300 (Increasing at 3% per year)
- John’s Monthly Mortgage (PITI + Maintenance): $3,200
| Financial Metric After 10 Years | Sarah (The Renter) | John (The Homeowner) |
| Initial Capital Deployed | $0 | $45,000 (Down Payment) |
| Average Monthly Cash Outflow | $2,640 (Accounting for inflation) | $3,200 (Fixed Principal/Interest + Variable Tax/Ins) |
| Total Liquid Capital Invested | $112,000 (Sarah put the down payment & monthly cash savings into the S&P 500) | $0 (John put all available cash flow into home upkeep and mortgage) |
| Ending Asset Value | $268,000 (Stock Portfolio at 8% return) | $604,000 (Home value after 3% annual growth) |
| Remaining Debt Balance | $0 | $345,000 (Remaining Mortgage Principal) |
| Friction Costs to Liquidate Asset | $0 | $36,240 (6% Agent & Closing Fees to sell) |
| Final Net Worth Contribution | $268,000 | $222,760 (Ending Home Value – Debt – Selling Costs – Initial Cash) |
Look closely at this editorial math. Even though John owned a valuable piece of real estate that grew significantly on paper, Sarah ended up with a higher total net worth after a decade.
Why? Because Sarah took the $45,000 she saved by not making a down payment, added the $900 a month she saved by having a lower housing payment, and funneled that capital into a compounding index fund. Sarah prioritized liquidity and asset velocity, while John locked his wealth inside four walls that demanded constant maintenance.
When This Backfires: The Operational Risks
Failing to analyze the structural vulnerabilities of your choice in the renting vs buying a home calculation guarantees a major financial crisis. Here is exactly how both sides can backfire aggressively:
1. The “Forced Appreciation” Trap (When Buying Backfires)
The biggest risk of homeownership is buying at the absolute peak of a local market cycle out of a fear of missing out (FOMO). If you buy a home for $500,000 with a 5% down payment, you owe the bank $475,000.
If the local economy experiences a major corporate layoff or interest rates spike further, home values can easily correct downward by 10%. Suddenly, your home is worth $450,000, but you still owe the bank $475,000. You are officially “underwater” on your mortgage. If you lose your job and are forced to move, you cannot sell the home unless you write a personal check to the bank for $25,000 to clear the remaining debt balance. You are trapped.
2. The Lifestyle Creep Mirage
When people buy a home, they rarely just pay the mortgage. Homeownership triggers an immediate, psychological urge to spend money. You suddenly need to spend $5,000 on custom window blinds, $4,000 on a riding lawnmower, and $10,000 to redo the backyard patio so it matches your vision. This lifestyle creep drains your remaining liquid cash reserves, leaving you entirely “house poor”—owning an incredible asset on paper, but completely unable to afford a dinner out with friends.
3. The Uncontrolled Displacement Trap (When Renting Backfires)
Renting offers incredible short-term flexibility, but it carries a severe long-term vulnerability: a complete lack of control over your fixed overhead.
If you rent a property in a gentrifying neighborhood, your landlord is legally permitted to raise your rent to match market rates at the end of every lease cycle. If your rent jumps by 15% two years in a row, you can easily be priced out of your own home. Furthermore, if the landlord decides to sell the property or move their own family member into the unit, you will receive a 30-day notice to pack your life up and move. Renting sacrifices security of tenure in exchange for immediate liquidity.
The Price-to-Rent Ratio: The Universal Decision Metric
You do not have to rely on intuition to solve the renting vs buying a home puzzle for your specific city. You can use a highly specific valuation metric called the Price-to-Rent Ratio.
This is the exact metric institutional real estate firms use to deploy billions of dollars of capital.
The Formula:
Price-to-Rent Ratio = Median Home Price in Your City ÷ Median Annual Rent for an Identical Property
Let’s look at the operational tiers of this ratio to see exactly what the math dictates for your money:
Price-to-Rent Ratio
├── 1 to 15   ──> Strongly Favors Buying (Properties are cheap relative to rent)
├── 16 to 20  ──> The Neutral Zone (Depends entirely on your timeline and mobility)
└── 21+       ──> Strongly Favors Renting (Properties are massively overvalued)
Real-World Example A (The Midwest Suburban Market)
- Median Home Price: $240,000
- Median Monthly Rent: $1,800 ($21,600 annually)
- Ratio Calculation: $240,000 ÷ $21,600 = 11.1
- The Verdict: The ratio is well below 15. In this specific geographic market, buying a home is a massive mathematical slam dunk. Owning will build wealth far faster than renting.
Real-World Example B (The Tech Hub Tier-1 Market)
- Median Home Price: $850,000
- Median Monthly Rent: $3,100 ($37,200 annually)
- Ratio Calculation: $850,000 ÷ $37,200 = 22.8
- The Verdict: The ratio is nearly 23. In this specific city, buying a home is a terrible deployment of capital. Renting is incredibly cheap compared to purchase prices. You should rent the property, pocket the massive monthly savings, and invest it directly into a broad-market index fund.
Frequently Asked Questions (FAQs)
1. Isn’t building equity always better than paying a landlord?
No, because equity is incredibly expensive to acquire early in a mortgage cycle. Due to standard amortization schedules, your initial payments are almost entirely devoured by bank interest. If you take the money you save by renting and invest it into liquid assets like index funds, that capital can easily grow faster than average residential real estate equity.
2. How long do I need to stay in a house to make buying worth it?
You should generally plan to hold a property for a minimum of 5 to 7 years. This timeline provides enough buffer for the home’s natural market appreciation to completely outpace the transaction friction of closing costs, title fees, and real estate agent commissions. If your career or relationship timeline is shorter than 5 years, renting is almost always the safer operational move.
3. Does renting really protect me from inflation?
In the short term, no—your landlord can raise your rent at the end of your lease to match inflation. However, in the long term, renting protects you from the inflating costs of home maintenance. The cost of roofs, plumbing repairs, foundation fixes, and homeowner’s insurance premiums all spike dramatically during inflationary cycles. As a renter, those rising operational costs are entirely your landlord’s problem.
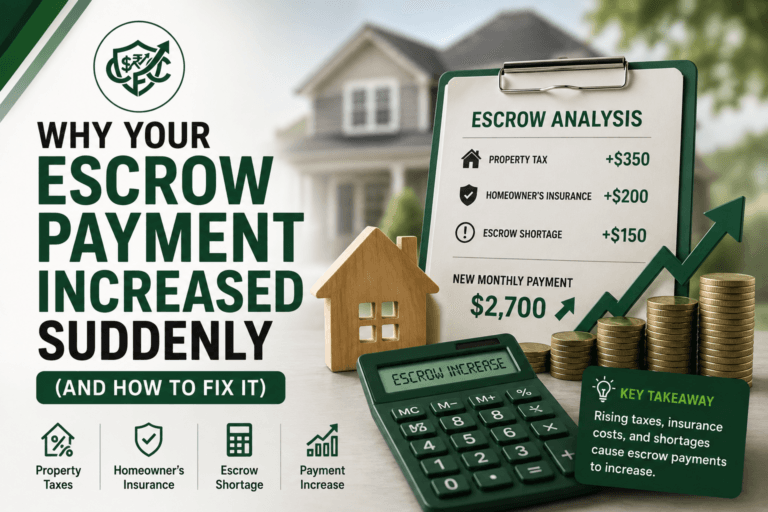
4. What is a “hidden cost” of buying that renters completely skip?
The most silent, destructive hidden cost is the Property Tax Reassessment. When a home transfers ownership, the local municipality updates the property’s assessed value to match the new, higher purchase price. This causes the property tax bill to skyrocket, frequently triggering a massive shortage in the homeowner’s escrow account and driving their monthly mortgage payment up by hundreds of dollars out of nowhere.
5. Can I use a regular savings account to save for a home down payment?
You can, but you are losing money to inflation if you use a traditional brick-and-mortar account paying 0.01%. While you are navigating the renting vs buying a home decision, your down payment cash must be parked in a dedicated High-Yield Savings Account (HYSA) or a Money Market Fund earning a competitive 4% to 5% return. This keeps your capital completely safe and liquid while ensuring its purchasing power doesn’t melt away.
The Bottom Line
The renting vs buying a home debate is not an emotional milestone. It is a calculated business decision where you are the chief financial officer of your own life.
Stop letting parents, peers, or real estate agents shame you into signing a 30-year debt obligation before your life and career are settled. Buying a home is a phenomenal wealth-generation strategy—but only if you are geographically stable, have a solid cash reserve to survive the 1% annual maintenance rule, and live in a market where the price-to-rent ratio justifies the risk.
If you are young, climbing the corporate ladder, or living in an overvalued tech hub, wear your rental status as a badge of operational efficiency. Protect your mobility, build a deep liquidity moat in the stock market, and deploy your capital where it treats your net worth with the highest level of respect.
Disclaimer: The information provided in this guide is for educational purposes only and does not constitute financial, investment, or tax advice. All financial products and offers are subject to individual credit approval and specific lender terms. Please consult with a qualified financial professional to determine if the strategies or products discussed in this guide are the right fit for your personal financial situation.
Sources & References
Articles published on Clarity Flow Core are reviewed using publicly available information from official financial institutions, government resources, consumer finance organizations, and trusted industry publications.
Reference sources may include:
- Internal Revenue Service (IRS)
- Consumer Financial Protection Bureau (CFPB)
- Federal Reserve
- U.S. Department of the Treasury
- Experian
- Equifax
- TransUnion
- myFICO
- Bureau of Labor Statistics (BLS)
- FDIC
- SEC Investor.gov
- Official banking, lending, insurance, and financial institution websites
- Public consumer finance studies and educational resources
Additional editorial references may include trusted finance publications, budgeting research, behavioral finance studies, and publicly available market data where applicable.