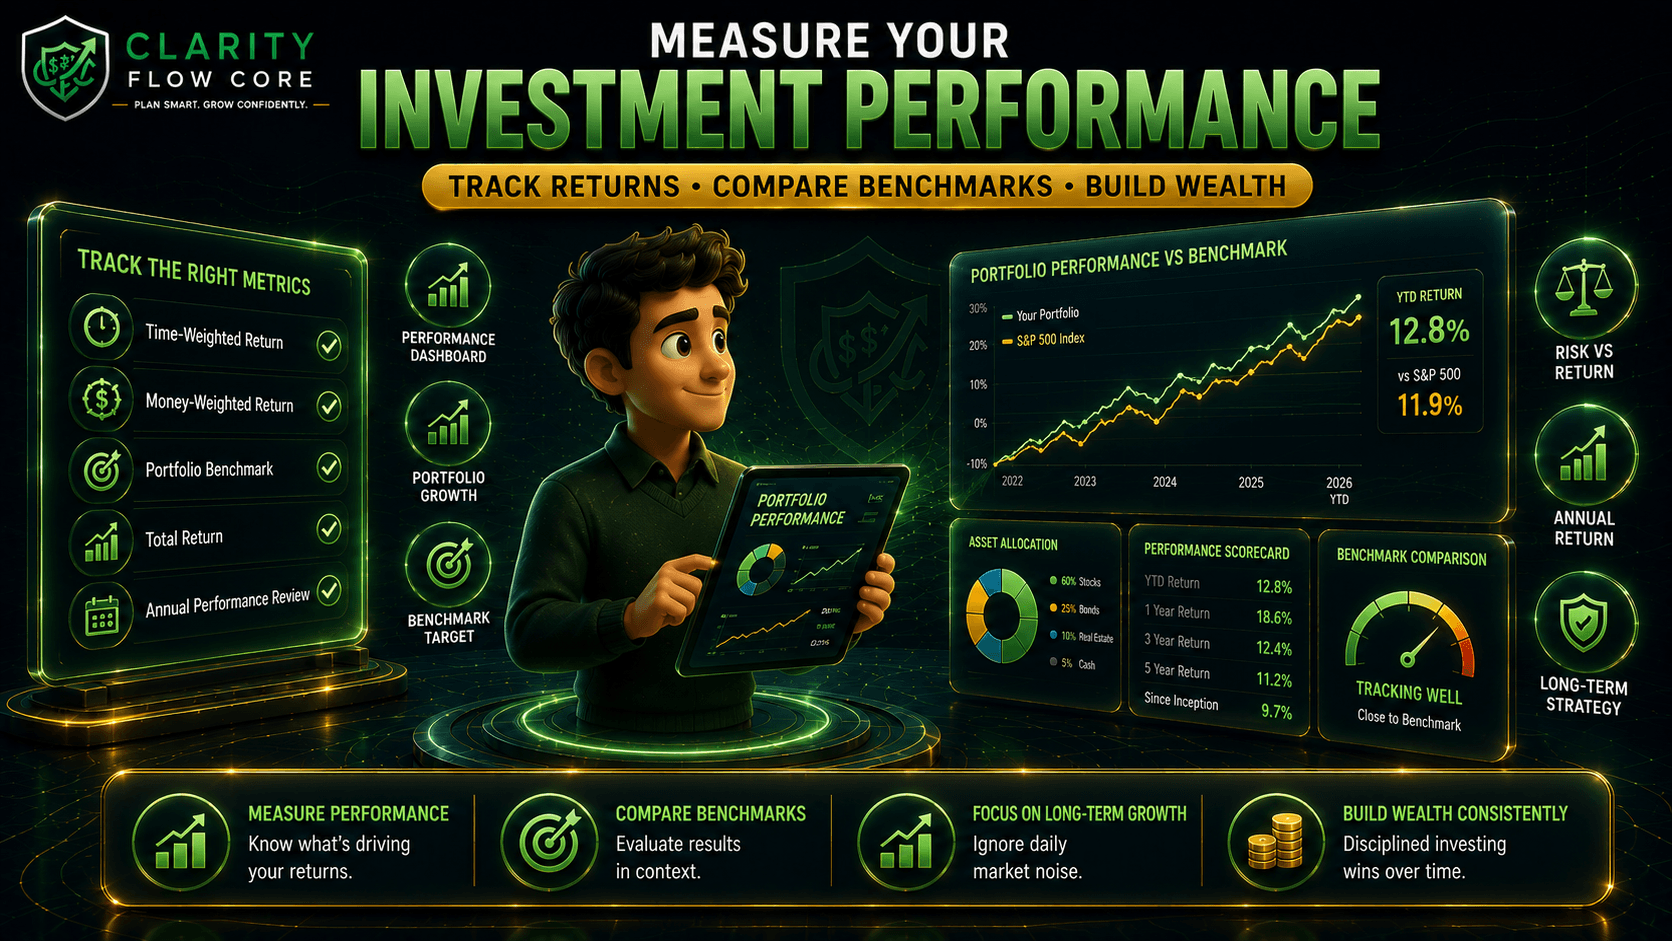
How to Measure Investment Performance the Right Way
Logging into a U.S. brokerage account can be an emotional rollercoaster. When the numbers are green, you feel like a financial genius; when they are red, you feel like you are ruining your future.
However, looking at the raw dollar amount in your account tells you almost nothing about how good of an investor you actually are. If your portfolio balance increased by $10,000 this year, but $9,000 of that came from your own cash deposits, your investments only actually generated $1,000.
To figure out if your strategy is actually working—or if you are secretly losing money to inflation and high fees—you must learn how to measure investment performance the right way.
Here is the definitive guide to calculating your true returns, selecting the correct benchmarks, and ignoring the daily noise of the stock market.
Phase 1: The Three Types of Returns
Before you can grade your portfolio, you have to understand the math your brokerage app is using. The percentage you see on your screen is usually calculated using one of three specific methodologies.
The Return Calculation Matrix
How the financial industry actually measures growth.
1. Simple Return
- The Math: (Current Value – Total Invested) / Total Invested.
- The Flaw: It completely ignores when you deposited the money. It treats a $100 gain over one month the same as a $100 gain over ten years, making it useless for long-term tracking.
2. Time-Weighted Return (TWR)
- The Math: Measures the compound growth of the underlying investments, stripping out the impact of your personal cash deposits and withdrawals.
- The Reality: This is the gold standard for judging if your specific fund choices are actually beating the market.
3. Money-Weighted Return (MWR)
- The Math: Factors in the size and timing of your deposits. (Also known as IRR).
- The Reality: It shows how your personal behavior (buying during a dip vs. buying at a peak) impacted your overall wealth.
Your Ecosystem Tool: Want to track your macro growth without getting bogged down in daily percentages? Monitor your big-picture progress with the Net Worth Tracker & Wealth Growth Planner.
Phase 2: The Importance of Benchmarking
You cannot evaluate your performance in a vacuum. If your portfolio grew by 8% this year, is that a success?
- If the overall U.S. stock market grew by 20% that same year, your 8% return is actually a massive underperformance.
- If the market crashed by negative 10%, your positive 8% return makes you a financial genius.
To know exactly how to measure investment performance, you must compare your returns to a “benchmark”—an index that represents the broader market.
If you invest heavily in large U.S. companies, your benchmark is the S&P 500. If you hold a 60/40 portfolio (60% stocks, 40% bonds), you cannot compare your returns solely to the S&P 500, because 40% of your money is deliberately held in safer, lower-yielding assets. You must compare your performance to a blended benchmark that matches your specific asset allocation.
Real-World Scenario: Tracking Erratic Cash Flow
Measuring performance accurately is critical when your income does not arrive in standard two-week paychecks.
Consider an independent freelance video editor who manages a digital financial content brand for a U.S. audience. Their income is highly irregular—some months they bring in $10,000 from a major commercial editing contract, and other months they earn nothing while they write scripts and create assets for their own platform.
Because of this, they dump cash into their brokerage account in random, erratic lump sums.
If they rely on a Simple Return calculation, their dashboard will look chaotic. A massive $5,000 deposit right before a 2% market dip might make it look like their entire portfolio strategy is failing.
Instead, they navigate to the “Performance” tab in their brokerage account and select Time-Weighted Return (TWR). This strips away the noise of their random freelance deposits, allowing them to see exactly how their core index funds are performing compared to the S&P 500 benchmark. It proves that their underlying strategy is sound, preventing them from making emotional trades during months when their cash flow is tight.
4 Deadliest Mistakes When Tracking Performance
As you monitor your wealth, avoid these four psychological traps that destroy new investors:
❌ Checking your dashboard daily: The stock market fluctuates every single second. Checking your portfolio daily induces unnecessary anxiety and leads to emotional panic selling. Track your performance quarterly or annually.
❌ Comparing conservative portfolios to aggressive benchmarks: If you are 60 years old and holding 40% of your money in safe U.S. bonds, your portfolio will never beat the S&P 500 during a bull market. That is by design. Your goal is wealth preservation, not high-risk growth.
❌ Forgetting about inflation and taxes: A 7% return looks great on paper, but if inflation is running at 3% and capital gains taxes eat another 15% of your profits, your “real” return is significantly lower. Always measure your true purchasing power.
❌ Chasing past performance: Just because a specific tech stock or mutual fund returned 40% last year does not mean it will do it again this year. Rebalancing based on what already happened is a guaranteed way to buy high and sell low.
Frequently Asked Questions
Are dividends included in my performance metrics? Yes. If you look at your “Total Return” (which is the standard metric used by most major U.S. brokerages), it calculates both the capital appreciation (the stock price going up) and the cash dividends paid out and reinvested into your account.
Why does my third-party app show a different return than my brokerage? Different platforms use different default calculations. Your brokerage might display a Time-Weighted Return, while a personal finance app might calculate a Simple Return or a Money-Weighted Return based on when you linked the account. Always check the methodology in the app’s settings.
What is a “good” average annual return? Historically, the U.S. stock market (measured by the S&P 500) has returned an average of roughly 9% to 10% per year over the long term, before adjusting for inflation. If your highly diversified portfolio is capturing a 7% to 8% annualized return over a decade, you are perfectly on track to build substantial wealth.
Your Action Plan
Now that you know how to measure investment performance the right way, it is time to grade your actual strategy. Take these three steps this week:
- Locate Your TWR: Log into your U.S. brokerage account (Fidelity, Vanguard, Schwab, etc.), navigate to the performance tab, and switch the view from “Personal Return” to “Time-Weighted Return.”
- Assign a Benchmark: Identify your current asset allocation using the Investment Portfolio Planner & Goal Allocation Analyzer. If you are 100% in U.S. stocks, benchmark against the S&P 500. If you hold international stocks or bonds, find a blended benchmark that matches your risk.
- Audit Your Strategy: If your TWR has consistently underperformed its matching benchmark for more than three to five years, you are likely paying too much in hidden fund fees. Consider switching to low-cost, broad-market index funds.
Sources & Further Reading
Official U.S. Guidelines & Consumer Resources
- Securities and Exchange Commission (SEC): Evaluating Performance
- Financial Industry Regulatory Authority (FINRA): Understanding Investment Performance
Essential Tools from Clarity Flow Core
Further Reading from Clarity Flow Core
- Asset Allocation Strategies for Beginners: The 2026 Guide
- How to Build an Investment Portfolio From Scratch (2026 Beginner Guide)
- Rebalancing Your Portfolio: When and How Often?
- How to Create an Investment Plan You Can Actually Stick To
Disclaimer: The information provided in this article is for educational and informational purposes only and does not constitute financial, legal, or tax advice. Past performance of any specific asset, index fund, or ETF is not indicative of future results. Investing in the stock market involves risk, including the possible loss of principal. Always consult with a certified financial planner (CFP®) or a registered investment advisor before making investment decisions or adjusting your portfolio strategy.
About Author

Rishabh Nigam
Rishabh Nigam founded Clarity Flow Core to make personal finance easier to understand for everyday readers. He covers credit scores, debt repayment, credit utilization, loan readiness, taxes, and financial planning through practical guides, calculators, and educational resources. His content focuses on turning complex financial concepts into clear, actionable steps that readers can apply in real life.